Golden Deception: The Fed’s Balance Sheet is Wrong
“The inflated imitations of gold and silver, which after the rapture are thrown into the fire, all is exhausted and dissipated by the debt. All scrips and bonds are wiped out. At the fourth pillar dedicated to Saturn, split by earthquake and flood: vexing everyone, an urn of gold is found and then restored.” – Nostradamus
I wish I read more books. When I was a young chicklet, I prided myself on reading at least one non-fiction book a week. Now, in the age of social media, information is served to me in bite-sized portions precisely curated by advanced algorithms to be perfectly suited to confirm all my pre-existing biases. There are some benefits to these technological developments, to be sure, but an undeniable cost, at least to me, is a shortened attention span.
Still with me? Good.
Last week, I decided to break away from social media for a day while I read James Rickards’ excellent book The New Case for Gold, originally published in 2016. Okay, so it isn’t quite new, but it was a case for gold, and I figured if I’m going to confirm my pre-existing biases, I might as well occasionally do it in long-form. I was enjoying the book fine enough when I was surprised to read the following passage pertaining to how much gold was on the Fed’s balance sheet, and, more importantly, how they account for the value of that gold:
“Those gold certificates were last marked to market in 1971 at a price of $42.2222 per ounce. Using that price and the information on the Fed’s balance sheet, this translates into approximately 261.4 million ounces of gold, or just over eight thousand tons. At a market price of $1,200 per ounce, that gold would be worth approximately $315 billion. Because the gold is held on the Fed’s balance sheet at only about $11 billion, this mark-to-market gain gives the Fed a hidden asset of more than $300 billion.”
While I consider myself reasonably well-informed about precious metals, I have to confess I never gave much thought to the Fed’s gold nor to how they mark it to market. In hindsight, I’m sure the Fed is quite pleased with that state of affairs (more on that later). I asked around, and while some gold bugs knew the details, they too hadn’t thought much about it, while many others were more in the dark like I was.
My second surprise came when I set about trying to create a full Fed balance sheet data set for myself so I could explore this new-to-me insight further. I like to chart things, in case you hadn’t noticed, and the first step to charting things is getting all your data neatly organized on your own computer. While I consider myself reasonably well-informed about how a Bloomberg machine works, I was surprised (and a little chagrined) to learn my all-powerful-really-expensive-strangely-addictive financial database only had Fed data back to the early 1990s.
At the risk of exposing my own ignorance once again (maybe my Bloomberg machine has it, and I just couldn’t find it and was too stubborn to press the help button twice, like so many lost dudes on the highways of America refusing to ask for directions before the advent of navigation systems?), I confess here that I spent several frustrating hours using the Google machine trying to find complete weekly Fed data, in usable form, back to the 1970s. I hit pay dirt at the website of the Institute for Applied Economics, Global Health, and the Study of Business Enterprise at Johns Hopkins’ Krieger School of Arts & Sciences. I’m grateful to Nicholas Fries for what follows (and curious about Valerie Vilariño’s work on bone marrow compensation, if I’m being totally honest).
With the Fed data from Fries, supplemented by data from my Bloomberg machine and the daily spot price of gold – easily connected to the weekly Fed balance sheet data thanks to the marvels of the VLOOKUP function – I was ready to hammer out charts faster than my hen mother laid the batch of eggs from which I eventually sprung.
We begin with a series of charts that capture key elements of the Fed’s balance sheet as reported (i.e., with an artificially low gold value). First, the carrying value of gold from 1976 to the present time: as you might expect, since the Fed hasn’t revalued its gold since 1971 and hasn’t sold or bought a material amount over the past decades either, the chart is a horizontal line.
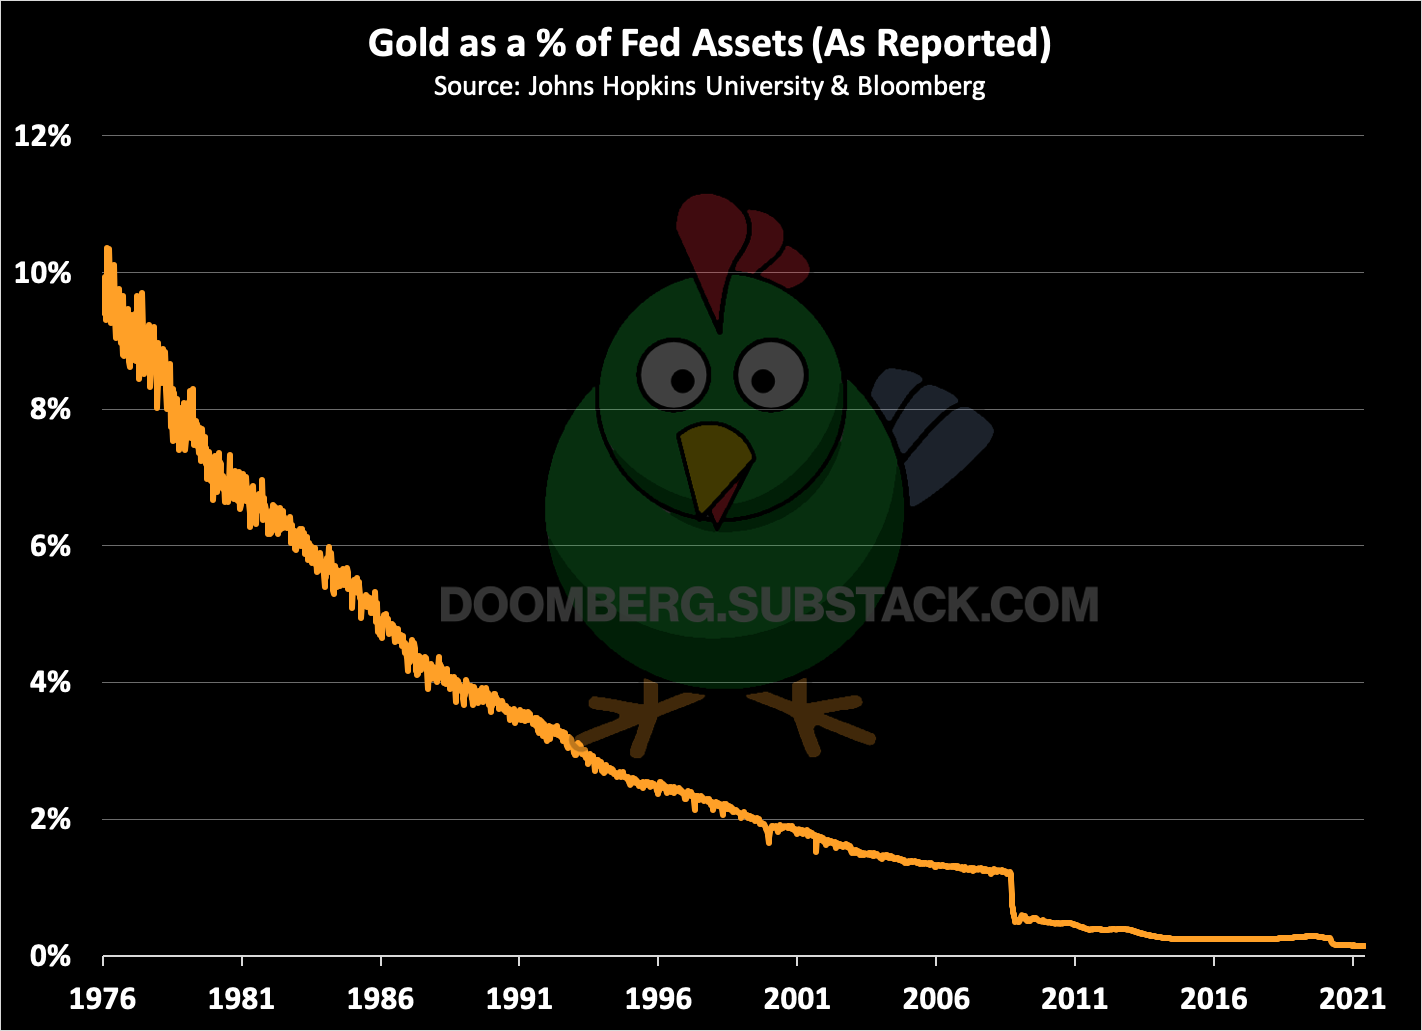
The Fed’s balance sheet has grown exponentially during the same period and thus the heritage gold mark of $42.2222 an ounce creates the illusion gold is irrelevant to its balance sheet. Here are the as reported numbers. Officially, gold is currently just 0.14% of the Fed’s assets.
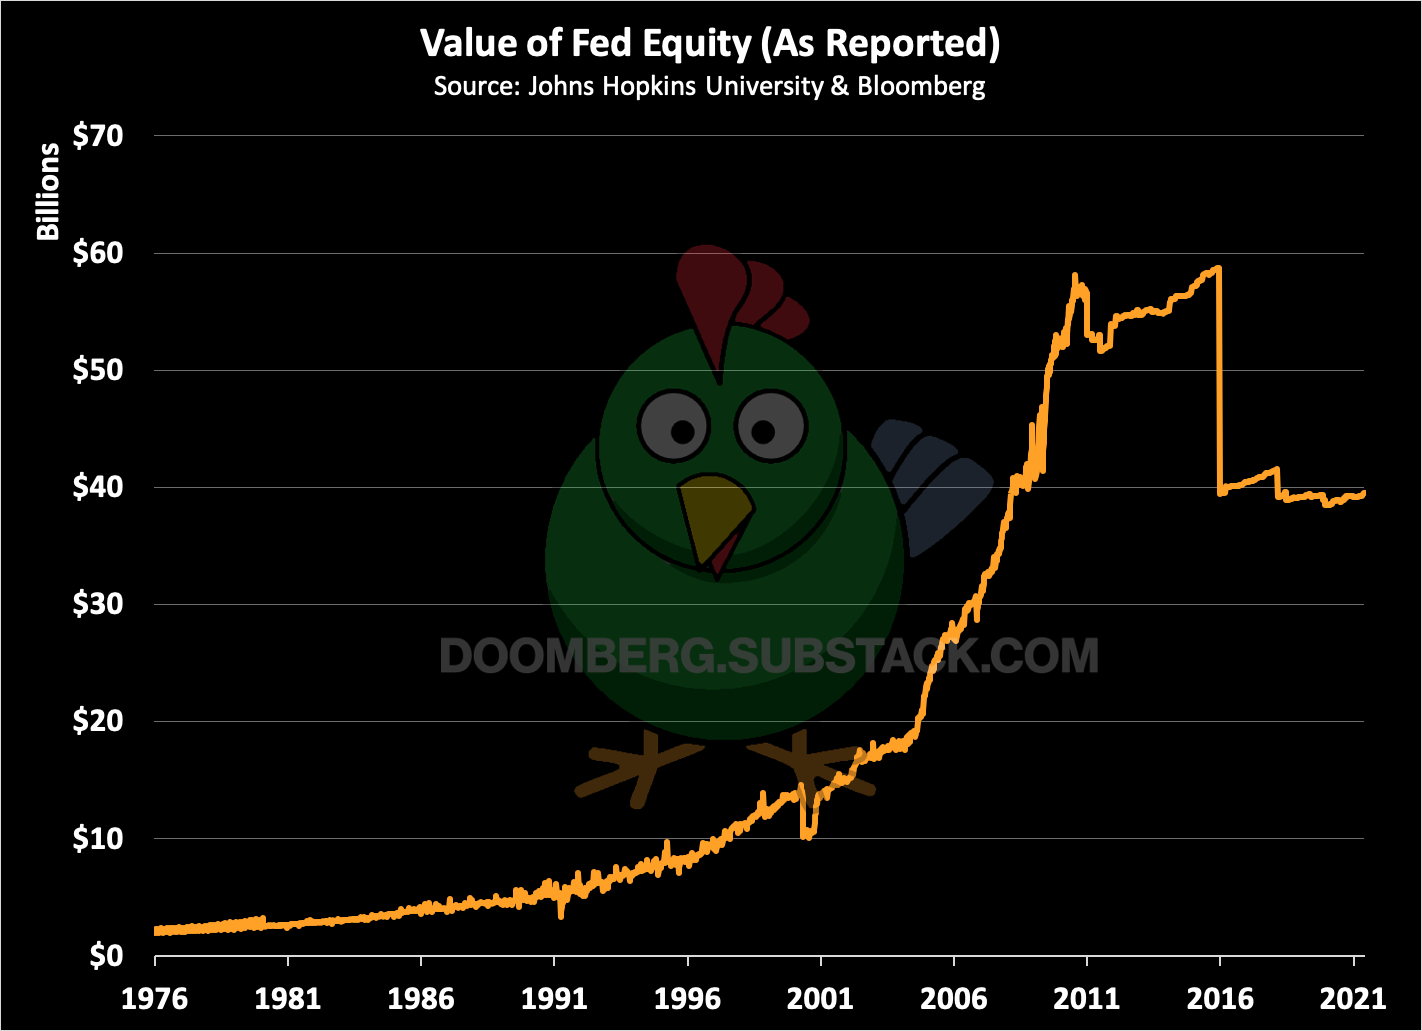
Like any balance sheet, the Fed’s has three parts: assets, liabilities, and equity (i.e., the excess of assets over liabilities). The Fed officially has comparatively little in the way of equity, reporting just under $39B.
This equity supports liabilities approaching $8 trillion (yes, trillion, with a “t”), meaning the Fed has an astronomical leverage ratio (again, keeping the old gold mark of $42.2222 an ounce). By traditional measures, a bank with a leverage ratio in excess of 200 is essentially insolvent.
What happens to these charts when we “fix” the price of gold, and assign to the Fed’s 261.4 million ounces the market value of our favorite precious metal, manipulated as that market value might be? Naturally, things look a lot different. First up, the corrected carrying value of the Fed’s gold in US dollars. The blue line at the bottom represents the “as reported” data seen earlier. The Fed does not have $11 billion of gold on its balance sheet – it has nearly half a trillion.
What percent of the Fed’s assets sit in gold? Instead of 0.14% as reported, the number is closer to 6%. What’s even more interesting to me is the historical trend. In the early 1980s, gold was a majority of the Fed’s assets. Thinking about it further, this chart captures both the debasement of the US dollar versus gold and the suppression of its price in US dollars. Gold is true money. Within certain market fluctuations, this chart should be a relatively horizontal line. As the Fed’s liabilities have grown, the price of gold in US dollars should have risen steadily. Instead, while the price of gold is nominally higher, the Fed has succeeded in having its cake and eating it too. Assume the natural percentage of gold backing the dollar should be 20%. In that circumstance, the price of gold in US dollars today should be about $6,000 an ounce. It isn’t, but it should be.
Naturally, correcting the gold price boosts the Fed’s reported equity substantially, which is a good thing. Instead of only $39 billion in equity, the number is higher by a half trillion, which is the simple consequence of adding back gold’s market value.
Finally, repricing gold allows us to reconsider the Fed’s leverage ratio. Instead of an alarming ratio of 200, the true leverage ratio is a little above 15. While more sound, it should be noted this number is still three times higher than the average leverage ratio observed from 1976-2012, once again pointing to price suppression of gold in US dollars.
What do I make of all this? Primarily, the Fed wants you to think gold isn’t money. It wants you to ignore that entry on its balance sheet. By separating your association of gold from its money (the US dollar), the Fed is free to accomplish its real dual mandate of debasing the currency while making sure as few people notice as possible. If gold was represented accurately, you’d notice how important it once was to the balance sheet, and you might begin to ask some serious questions. We can’t have that.
As I’ll detail in future Doomberg reports, other nations are noticing. The Russians and the Chinese know what’s going on. Under the watchful eye of the Fed, they’ve been taking advantage of the unnaturally low price of gold and have been chewing up supply for years. In fact, gold is now more than 20% of Russia’s reserve assets, and certain factions have already begun to jettison the dollar.
As I’ve been squawking, there are consequences to suppressing prices below their natural market value:
“When the price of a desirable good is held below its natural market equilibrium value, demand will continue to chew up supply until it is exhausted or price is finally allowed to rise.”
Recent actions indicate some are readying themselves for the great currency reset. Are we?
If you enjoy Doomberg, sign up yourself and share a link with your most paranoid friend!


The Fed "owns" no gold. It has "certificates" from the Treasury, from the 1934 Transfer. In addition, the gold held by the Treasury is encumbered by international agreement, ( Bretton
Woods ) which was "temporarily" suspended in 1971, and after 3 years of attempts to resolve
international monetary system issues, the suspension became "indefinite". The legally binding
agreement remains in limbo, but the gold is not free to be used internationally.
cheers!
So.. the Fed have successfully hidden the value of gold for 45 years. Why would the price of gold rebalance now or in the near future? Is there not enough gold on the market?